I found another website with Orange County COVID-19 data but with details by city and better visualization tools. Here is the number of new cases daily from March:
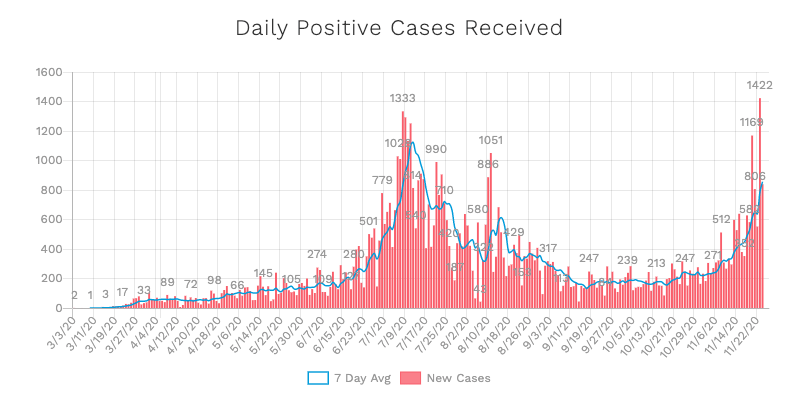
It’s pretty clear from this chart that there is a new wave of infections. If it’s correlated to people’s behavior during a holiday, then we’re in big trouble since Christmas and New Year’s Day is coming up soon. Here is the hospitalization data:
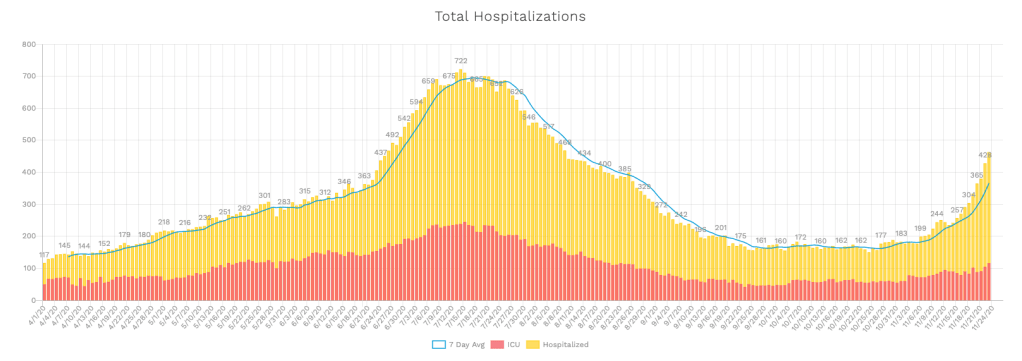
It doesn’t looks as bad yet but maybe there is a lag from when a person is infected to when they symptoms are serious enough for hospitalization. Alternatively, there were more hospitalizations in the first wave because no one was prepared. Now people in higher risk groups are taking more precautions so new infections are from healthier/younger people that tend to have less symptoms. It’s hard to tell without more analysis of the raw data.
Another thing you hear all the time is Los Angeles County people complaining or shaming Orange County for it’s anti-maskers. I think that’s overblown since I see everyone wearing masks. For comparison, here is the number of cases per 100k for Orange County (bar) vs. Los Angeles County (line):
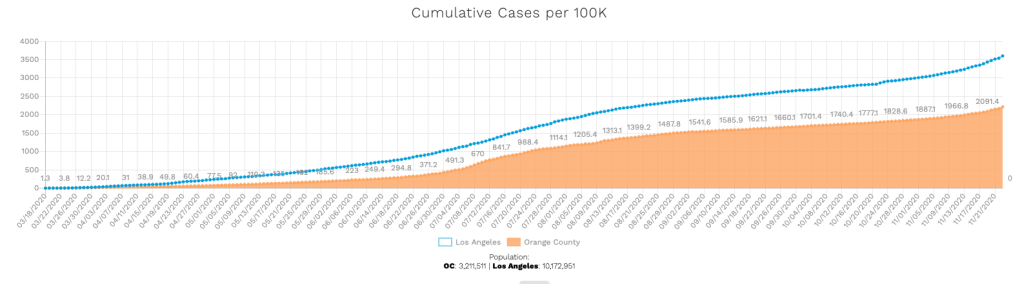
Not even close. Sure there are more people in Los Angeles County and the population density is higher, but LA’s case rate per capita is almost twice when compared to OC. If you look at the case rates by city, the anti-masker hotspots of Huntington Beach and Newport Beach are doing quite well in comparison to the rest of OC:
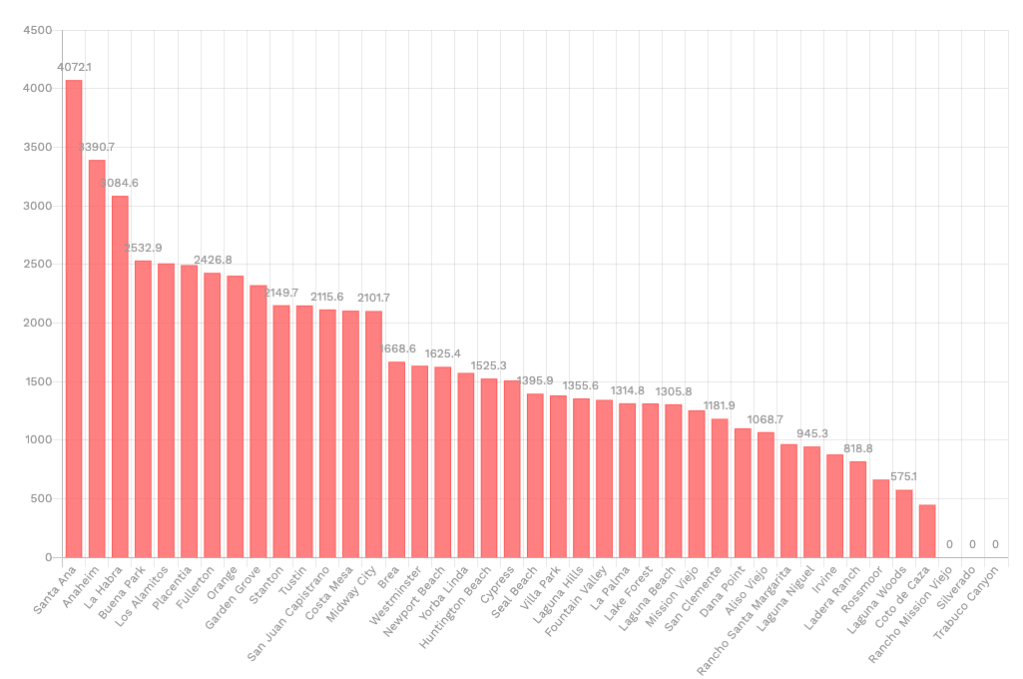
I think it’s fine to make sun of the anti-mask “Karens” or OC housewives but that can’t be the primary driver of the increases in cases. Personally, I think it’s due to people getting “quarantine” fever and going out to attend social functions.
