Three and a half months post-transplant, most of my test results are looking normal. Even my blood pressure, which has fluctuated a lot both before and after transplant, has settled down somewhat to ~140 systolic standing and ~120 standing. The only remaining problem is blood sugar. I have type 2 diabetes for many years. While on dialysis, whatever insulin I naturally produce stays in my body since it is not filtered out during dialysis. However, post-transplant, the combination of anti-rejection medication side effects and new kidney flushing out insulin means high blood sugar and need for insulin shots. I finally figure out how to export and graph blood sugar readings from my meter. Here is data since last November when I switched to the new meter:
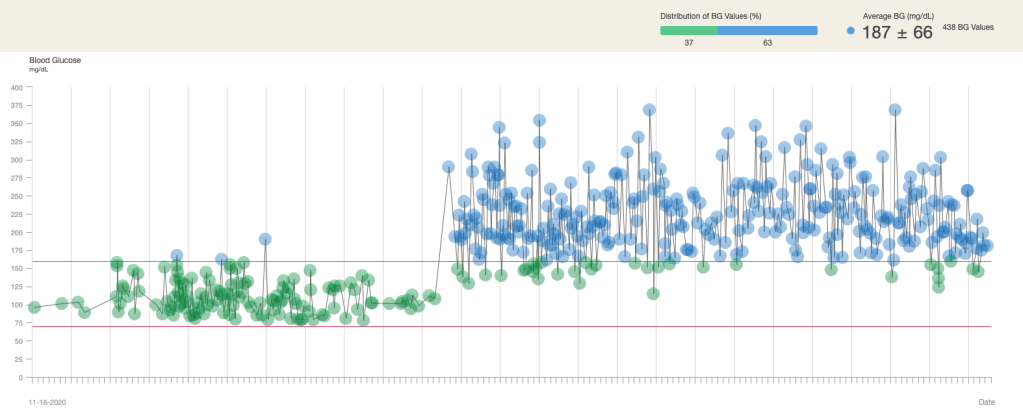
The text is a bit hard to read, but it is pretty obvious when the surgery occurred. Post-surgery, I have been on three different insulin injection schedules. Again, it is hard to see, but the first 1/3 period after transplant was just Humalog on a sliding schedule. The second 1/3 period was two insulin pens but at a low dosage. Finally, the last 1/3 period has the same two insulin pens but will a higher dosage. There is a slight downward trend at the end of the graph. It is likely a combination of lower tacrolimus dosage and me actively avoiding food with added sugar. Hopefully the trend continues.
The data also says that there are 438 readings on the chart. The time scale is just shy of six months so that averages out to 2.5 lancet pricks per day. If you look at the fingertips of my left hand, you can definitely see hundreds of tiny dots showing where blood was taken for each blood sugar reading. My iPhone 12 camera cannot focus close enough to get a decent photo; I may have to get out my SLR and a macro lens to see if I can get a clear pic.